
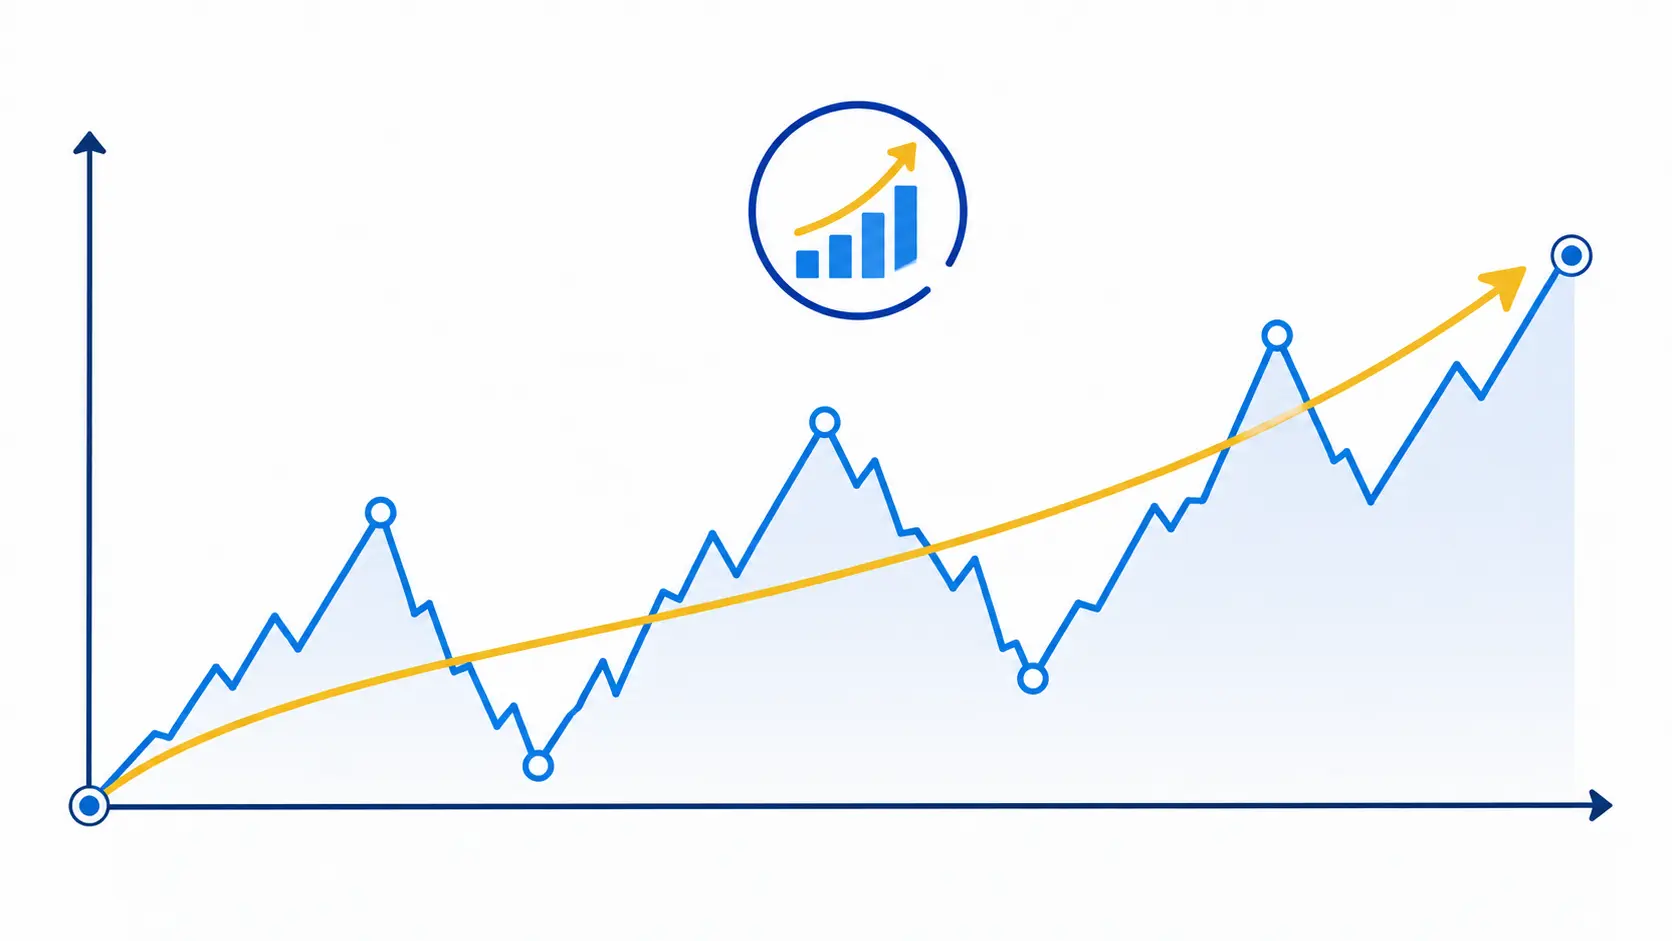
An investment that goes up 50% one year and down 30% the next didn’t actually grow at an average of 10% a year. That simple average is misleading, and it’s exactly the problem CAGR was built to solve. Here’s how it works, with a real example.
What Is CAGR?
CAGR, or Compound Annual Growth Rate, smooths out the year-to-year ups and downs of an investment into a single, consistent annual growth figure. It answers a specific question: “If this investment had grown at the exact same rate every single year, what would that rate have been?”
The CAGR Formula
CAGR = [(Ending Value ÷ Beginning Value)^(1 ÷ Number of Years)] − 1
Real Example: $10,000 Grows to $18,500 Over 5 Years
Let’s calculate.
- Beginning value: $10,000
- Ending value: $18,500
- Time period: 5 years
CAGR = [(18,500 ÷ 10,000)^(1/5)] − 1 CAGR = [1.85^0.2] − 1 CAGR = 1.1309 − 1 = 13.09%
That means this investment grew at a smoothed, consistent rate of about 13.1% per year over the 5-year period, even if the actual year-to-year returns varied significantly along the way.
Why CAGR Beats Simple Average Return
Here’s where CAGR earns its keep. Imagine an investment that returns +50% in year one, then −30% in year two.
Simple average: (50% + (−30%)) ÷ 2 = 10%
That looks like solid growth. But let’s check the actual dollar result on a $10,000 starting investment:
- Year 1: $10,000 × 1.50 = $15,000
- Year 2: $15,000 × 0.70 = $10,500
The investment only grew from $10,000 to $10,500 over two years — a true CAGR of just 2.47%, nowhere close to the misleading 10% simple average. Investopedia’s explanation of this exact discrepancy covers why volatility always drags real compounded returns below the simple average.
What Counts as a “Good” CAGR?
It depends heavily on the asset class and time period, but a few rough benchmarks:
- Broad stock market index funds: historically around 7–10% CAGR over long multi-decade periods
- Real estate: often 3–5% CAGR for property value appreciation alone, before rental income
- High-growth individual stocks: can post 20%+ CAGR over shorter periods, though rarely sustainable indefinitely
- Savings accounts/CDs: typically 3–5% CAGR in a normal rate environment, with minimal risk
Morningstar’s historical return data is a useful reference point for comparing your own CAGR calculations against long-term asset class benchmarks.
Using CAGR to Compare Different Investments
CAGR’s biggest strength is comparability. Two investments with wildly different year-to-year volatility can be compared fairly on a single CAGR figure, since it strips out the noise of individual year swings. This makes it far more useful than simple average return when evaluating mutual funds, stocks, or business revenue growth over multi-year periods.
Limitations of CAGR
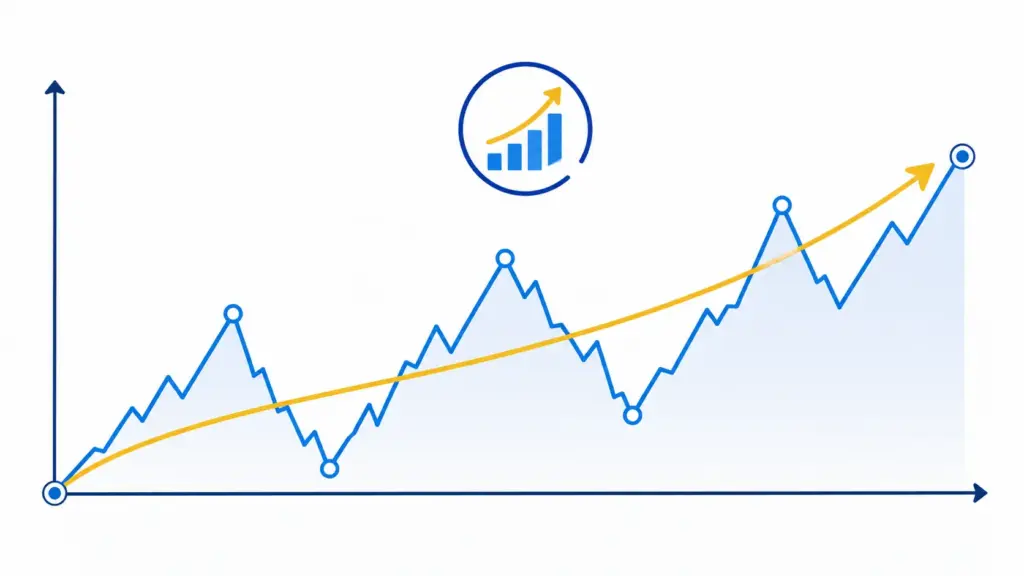
- It hides volatility entirely — two investments with the same CAGR can have very different risk profiles, since one might be steady while the other swings wildly year to year
- It assumes smooth, consistent growth that rarely reflects reality, since actual returns almost never repeat identically each year
- It’s sensitive to the specific start and end dates chosen — cherry-picking a favorable starting point (right after a downturn, for example) can make CAGR look artificially impressive
The CFA Institute’s guidance on return metrics recommends pairing CAGR with volatility measures like standard deviation for a fuller picture of investment performance, rather than relying on CAGR alone.
Calculate your own investment’s CAGR. Use the CAGR Calculator →
Frequently Asked Questions
What is a good CAGR for stocks?
Historically, broad stock market index funds have delivered roughly 7–10% CAGR over long multi-decade periods, though individual stocks or shorter time periods can show much higher or lower figures with correspondingly more volatility.
Is CAGR the same as average annual return?
No. Average annual return simply averages each year’s percentage return, while CAGR accounts for compounding, giving a more accurate picture of actual growth, especially when returns vary significantly from year to year.
How is CAGR different from ROI?
ROI measures total return over the entire holding period without factoring in time, while CAGR expresses that same growth as a smoothed annual rate, making it more useful for comparing investments held over different time periods.
Can CAGR be negative?
Yes, a negative CAGR indicates the ending value was lower than the beginning value, reflecting an overall loss smoothed into an annual rate, even if some individual years within that period actually showed gains.
Why does CAGR matter more than total return?
Total return doesn’t account for how long it took to achieve that growth, making it hard to compare investments held for different periods. CAGR normalizes everything into an annual rate, enabling fairer side-by-side comparisons.
Does CAGR account for dividends or additional contributions?
Standard CAGR only measures the change between a beginning and ending value. If dividends were reinvested or reflected in the ending value, they’re captured, but CAGR doesn’t separately account for additional contributions made during the period, which would require a different calculation like XIRR.